Kalium channelrhodopsins as effective neural inhibitors
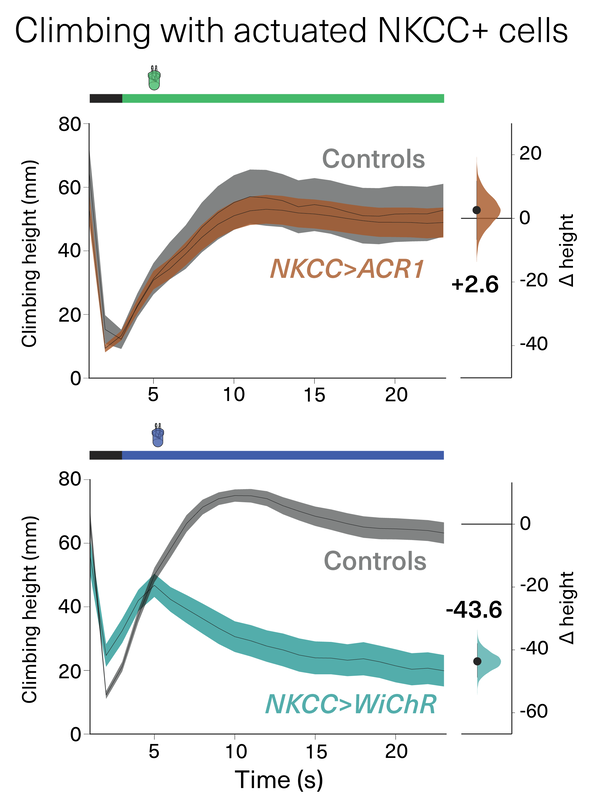
We evaluated the utility of KCRs to suppress behavior and inhibit neural activity in Drosophila, C. elegans, and zebrafish. In direct comparisons with ACR1, a variety of KCRs with enhanced plasma-membrane trafficking displayed excellent potency, and with improved properties that include reduced toxicity and superior efficacy in putative high-chloride cells. This comparative analysis of behavioral inhibition between chloride- and potassium-selective silencing tools establishes KCRs as next-generation optogenetic inhibitors for in vivo circuit analysis in behaving animals.
Read more in Nature Communications.
8 May 2024